 Enterprise · Conversion Optimisation
The headline numbers. At a glance.
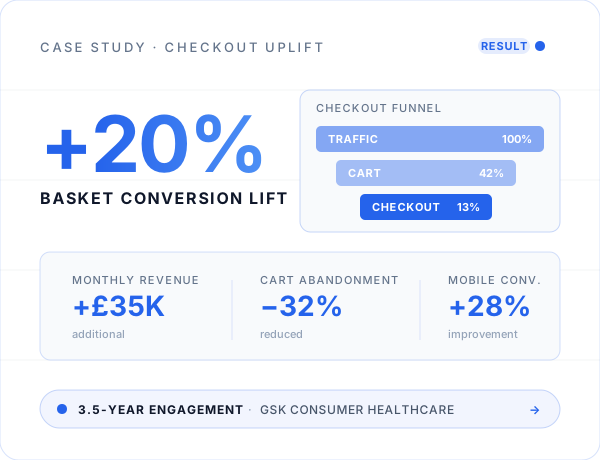
20%
Conversion uplift
£35k
Monthly revenue uplift
What needed solving.
GSK Consumer Healthcare had 15+ brand websites and a D2C ecommerce channel with no coherent analytics strategy. Traffic was strong but conversion was poor — particularly on mobile — and there was no visibility into where or why customers were dropping off. The business was also navigating a competitive landscape against pure-play partners including Amazon.
The work. In their words.
Built the end-to-end analytics roadmap for all brand websites and ecommerce channel
Produced monthly dashboards covering KPIs, share of voice, competitor analysis and conversion
Integrated Google Analytics, Omniture and CRM (Servoy) for segmentation and targeting
Identified 70%+ basket abandonment at checkout — mapped full drop-off analysis
Recommended Guest Checkout and mobile-first UX improvements
Used Hitwise to map 150+ competitor websites and identify B2B trading partners
Analysed price elasticity and promotional impact across brand sites and Amazon
Platforms and tools used.
Outcomes. That mattered to the business.
20%
Increase in basket conversion rate
£35k+
Additional monthly revenue
150+
Competitor sites mapped via Hitwise
6
New B2B trading partners identified
Common questions.
How the problem was diagnosed, what changed, and how the revenue figure was measured.
Basket abandonment above seventy percent across more than fifteen brand ecommerce sites. The business knew the figure was bad but not which step caused it, so nobody could agree on what to fix first or where the money was actually leaking away.
By mapping the full checkout funnel step by step and measuring drop-off at each one, rather than looking only at the headline abandonment rate. That located the losses precisely: forced account creation, and a mobile checkout that was genuinely difficult to complete.
Two recommendations did most of the work: introducing guest checkout so buyers were not forced to register, and rebuilding the checkout mobile-first. Both came from behavioural data rather than opinion, which is a large part of why they were approved and shipped.
It is the additional revenue from the conversion uplift applied to existing checkout traffic, measured after the changes went live rather than forecast beforehand. Because traffic volume did not change over the period, the gain is attributable to the checkout work itself.
Yes, and usually faster. A single site with one checkout is far quicker to map than fifteen. The method — measure every funnel step, fix the largest drop-off, verify the result with data — is the same regardless of scale.